
How Many Website Leads Should a Cash-Pay Practice Get Each Month?
Owners ask us all the time whether 19 website leads a month is good. It is an honest question, and it has no honest answer. “Good” depends on their ticket size, service mix, market, front desk, and revenue goal — none of which are in the number 19. At one practice we work with, monthly website leads moved from 5.5 to an average of 54, with a peak month of 67. That practice did not get there by hunting for an industry average. Instead, it calculated what it actually needed and then measured itself against itself. Here’s how many leads and calls your practice should expect, and how to tell whether your number is low.
How many website leads should a cash-pay medical practice get each month?
There is no universal benchmark.
The right number is whatever it takes to hit your new-patient target at your current conversion rate. The only useful comparison is against your own trailing 90 days.
Every benchmark you find online averages practices that do not resemble yours.
A single-service liposuction clinic and a practice offering joint pain, shockwave, hormone therapy, and concierge primary care have completely different lead economics.
Meanwhile, a clinic whose patients call instead of filling out forms may look starved on paper while its schedule is full.
A clinic with a $500 average case also needs far more leads than one with a $12,000 average case.
Shopping for one number to describe all those practices produces a number that describes none of them.
What travels across practices is not the volume. It is the direction and the ratios.
At Everest Regenerative Medicine in West Fargo, North Dakota, website leads averaged 5.5 per month before the work started.
Across the nine tracked months, that average increased to 54 per month — a 10x lift. The best single month reached 67.
That comparison means something because it involves the same doctor, town, and services, measured the same way on both sides.
Your own before-and-after has that same property. An industry average never will.
If you want a framework for how leads, calls, and booked patients should relate, our patient acquisition approach treats them as one connected system rather than four separate scoreboards.
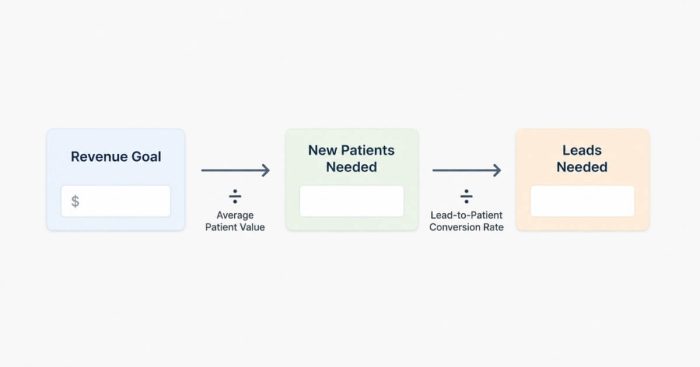
How do I work backwards from a revenue goal to a monthly lead target?
Divide your revenue goal by your average patient value to get the new patients you need. Then divide that number by your lead-to-patient conversion rate.
Run it with placeholder figures first, then substitute your own.
Say you want $200,000 a month and your average patient is worth $8,000 in the first year.
That means you need 25 new patients a month.
If one in five leads becomes a patient, you need 125 leads. If one in three converts, you need 75.
Those figures are illustrative placeholders, not benchmarks.
The calculation only requires two numbers from your business: what a patient is worth and what share of leads become patients.
Most owners cannot produce those two numbers on demand. That is the actual problem.
It is also why this kind of engagement starts with a business audit and tracking setup rather than a campaign.
You cannot scale a practice you can’t measure. And you certainly cannot set a lead target for one.
Once the arithmetic is visible, the conversation changes.
“Are 19 leads enough?” becomes “I need 75 and I have 19.”
Now you have a specific gap with specific fixes.
Alternatively, you might discover, “I need 20 and I have 19.” In that case, the constraint sits somewhere else, and more traffic would waste money.
Doubling your conversion rate also cuts your required lead volume in half.
That is often cheaper and faster than doubling traffic.
It is why the practice that moved from 5.5 to 54 website leads a month rebuilt its website, implemented a CRM, and trained its staff before scaling the ad budget.
The target tells you how big the number needs to be. It does not tell you which lever to pull.
How do I tell whether my lead number is actually low?
Compare it to three things: your trailing 90 days, the number your revenue math says you need, and the ratios between your metrics.
If all three look fine, your number is not low, no matter what a benchmark article says.
The ratio check is the part most owners skip.
Traffic up and leads flat points to a website or offer problem.
If leads rise while booked patients stay flat, look at follow-up and the front desk. When bookings increase but revenue stays flat, investigate pricing or case acceptance.
Each situation looks similar from the top of the funnel. Yet each requires a completely different fix.
That is why a raw lead count alone cannot diagnose a lead problem.
Ratios also become more useful at volume.
Everest’s nine months produced 3,490 total inbound calls and 1,310 first-time patient calls.
That volume made the relationships between stages more stable rather than anecdotal.
This is the real reason to track. The goal is not to admire the totals but to locate the constraint.
Practices in regenerative medicine and other cash-pay categories tend to have long consideration windows.
As a result, stage-to-stage ratios can be more informative than any single month’s raw count.
How long should I track before deciding my lead volume is too low?
Use a trailing 90-day average and require three consecutive readings before you conclude anything.
That window helps absorb the noise.
Cash-pay demand swings with holidays, weather, local events, and whatever your competitor did last month.
A single soft month tells you very little.
Ninety days absorbs much of that variation while remaining short enough to be actionable.
Set the window once and stop re-litigating individual weeks.
The three-reading rule then turns that window into a decision.
One 90-day average is a position. Three consecutive readings can reveal a trend.
However, your definition of a “lead” must remain identical throughout the window.
Keep the same forms, call criteria, and tagging rules.
If the definition changes halfway through, the data can manufacture a trend that never existed.
Why do total inbound calls hide new patient demand?
Because total call volume includes existing patients — rescheduling, billing questions, refill requests, and follow-ups.
Therefore, total calls can barely move while new demand multiplies underneath them.
Everest is a clean demonstration.
Total inbound calls went from 263 to 379 a month, a 44% increase.
First-time patient calls, by comparison, went from 50 to 173 a month — a 3.5x increase.
Same practice. Same nine months. Same phone lines.
Watching total call volume alone would suggest a decent increase.
Watching first-time calls reveals that new patient demand more than tripled.
Only one of those numbers predicts next year’s revenue.
The dilution also gets worse as you grow.
Every new patient eventually creates future non-new calls. Therefore, the existing-patient share of phone volume can climb as acquisition improves.
Total volume is a workload metric.
It is useful for staffing the front desk but useless for judging marketing.
Split the two in your call tracking and CRM. Tag first-time callers when the phone is answered, then report them separately.
If you change only one thing after reading this article, change this one.
What if my leads go up but my bookings don’t?
Then you bought more conversations, not more patients.
The constraint has moved from marketing to your sales process. More lead volume can now make things worse rather than better.
Lead count is easy to inflate and celebrate.
Loosen your form, run broader keywords, or add a giveaway, and the chart can rise next week.
What matters is leads multiplied by booking rate.
If leads rise 40% while booking rate falls 40%, you have spent money without creating the growth you expected. You have also added work for your front desk.
Track booking rate every month next to lead volume so a falling rate is difficult to miss.
Some dilution is normal when you open new channels.
At Everest, website leads rose 10x while new patients increased from 12.5 to 32 a month, a 2.6x lift.
However, read those as two separate results rather than one ratio.
New patients also arrive by phone. During the same nine months, the practice averaged 173 first-time patient calls a month.
Therefore, website leads and new patients describe different funnels. You cannot divide one into the other to calculate a booking rate.
The point about dilution is a general one about funnel behavior. Those figures do not prove it on their own.
The correct response is not to shut off the channel. Instead, work to hold booking rate steady while volume climbs.
That is why weekly accountability meetings were part of the engagement. It is also why the practice tracked 631 CRM opportunities rather than estimating them.
A different practice we work with, Orthobiologics Associates at a 79.4% lead-to-booked rate, shows what the ceiling can look like when the sales process itself is optimized.
Volume and rate are two different jobs. The second one is never the ad platform’s fault.

What is a realistic lift in website leads for a practice that fixes its tracking and website?
Results vary widely. They depend on the practice’s own clinical and sales execution as much as the marketing.
So read any single figure as one practice’s outcome rather than a promise.
In the Everest case, website leads went from 5.5 to an average of 54 a month, with a peak of 67.
That happened alongside a website rebuild, CRM implementation, staff training, SEO, and scaled Google Ads.
Notice how much is bundled inside that multiple.
It is not simply the output of a media buy. Five things changed at once in a practice that had almost no measurement in place beforehand.
That is exactly the condition where large multiples can become available.
The important point is what this means for your forecast.
A practice starting at 5.5 leads a month has a very different ceiling from one already producing 40 leads from a website that works.
Nobody should sell the first practice’s multiple using the second practice’s numbers.
The lower your starting point and the worse your instrumentation, the bigger the available lift may be.
That describes where you are starting from. It is not a claim about how good anyone’s marketing is.
Set your expectation using your own revenue math. Then judge the work against your trailing 90 days.
Ready to work out the lead number your practice actually needs?
Stop asking whether your lead number is good.
Instead, ask whether it is the number your revenue goal requires.
Separate first-time calls from total calls. Put booking rate next to lead volume. Then measure yourself against your trailing 90 days instead of somebody else’s average.
That reframe turns vague anxiety into a specific gap with a specific owner and fix.
You can’t scale a practice you can’t measure. Most practices are not under-marketed so much as under-instrumented.
On a 60-minute strategy call with Real ADvice, we work through your actual numbers.
We look at what a patient is worth and what your lead-to-patient conversion rate really is once first-time calls are separated out.
Next, we calculate how many monthly leads your revenue goal requires.
From there, we identify where the constraint sits between traffic, website, follow-up, and case acceptance.
You leave with the arithmetic done and the bottleneck named, whether or not you ever work with us.